Adobe Insights Dashboard
Adobe Insights allows resellers to see visual information about their subscriptions and business trends. Adobe Insights consists of a dashboard providing detailed insights on the distribution of SKUs, volume discounts, active subscriptions, business growth, etc.
To see the dashboard, click Adobe Insights in the left menu of UX1 for resellers.
Note: L2 resellers need to purchase the Adobe Insights service plan to see the Adobe Insights dashboard.
Summary
In the Summary tab you will find different charts showing the distribution of SKUs, volume discounts, percentage of purchases and transfers, and types of subscriptions (Teams vs Enterprises).
-
SKUs distribution: This pie chart allows resellers to see the sum of active licenses for Adobe products over a period of time. Each sector in the pie chart represents the sum of active licenses for a particular Adobe SKU. Hovering the mouse cursor over a pie chart sector will display the number of licenses, along with the percentage of licenses that a particular SKU represents from the total.
-
Volume discount: This chart shows the number of active subscriptions in a given discount level as well as the percentage of the total.
-
Purchase vs Transfer: This graph compares the net new subscriptions against the transfers.
-
Type mix: It shows a comparison between SKU segments. For example, (Teams vs Enterprises).

For each of these tasks, you can select the period that you wish to see by clicking Manage period. To see additional details, you can hover the mouse pointer over the different charts.
Subscriptions
In the Subscriptions tab you can see a table containing all your active subscriptions. Additionally, if there is a price list in the listing for the reseller, the consolidated reseller price and the MRSP will be displayed.
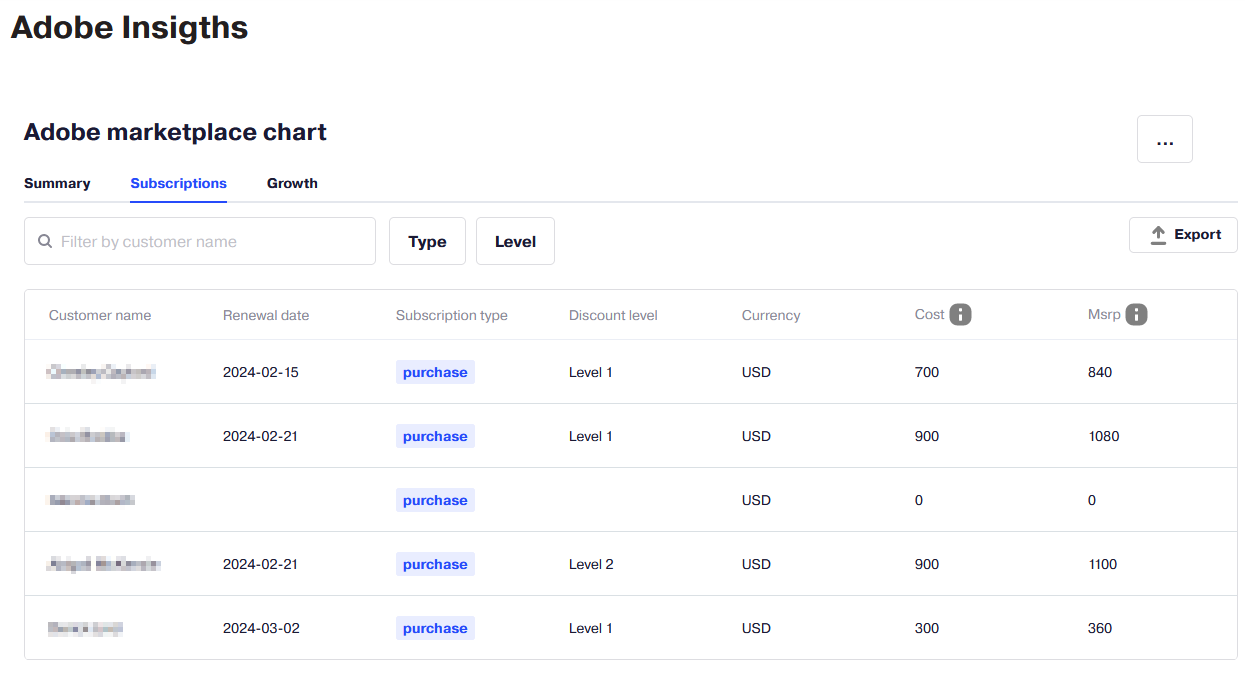
You can filter the information by customer name, type of subscription (net new or transfer) and discount level.

All the displayed data can be exported to an Excel spreadsheet by clicking the Export button.
Growth
In the Growth tab you can see the following charts representing the business growth:
-
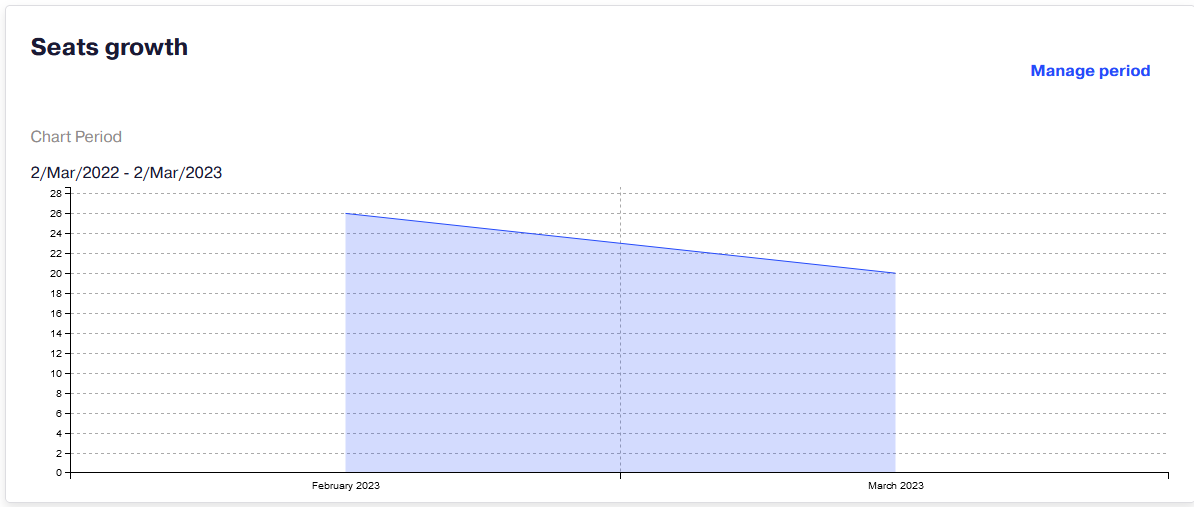
Seats growth over time: This chart shows the number of active licenses (not subscriptions) considering when such licenses were added or removed. Hovering the mouse cursor over the chart will allow you to see the number of active licenses on a given date.
-
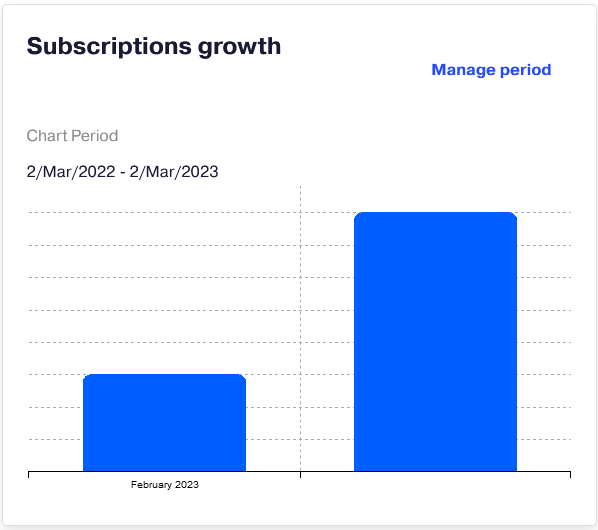
Subscription growth over time: This stacked bar chart allows you to see the number of active subscriptions on a particular month.
-
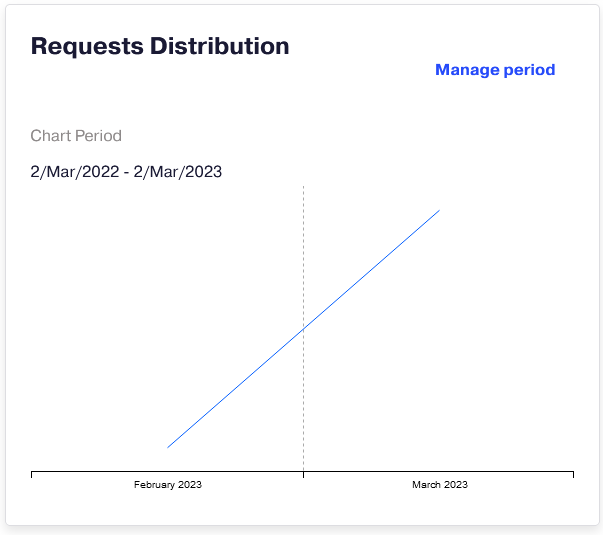
Requests distribution: It allows you to see the number of request types that have been processed (purchase requests, change requests, etc.).
-
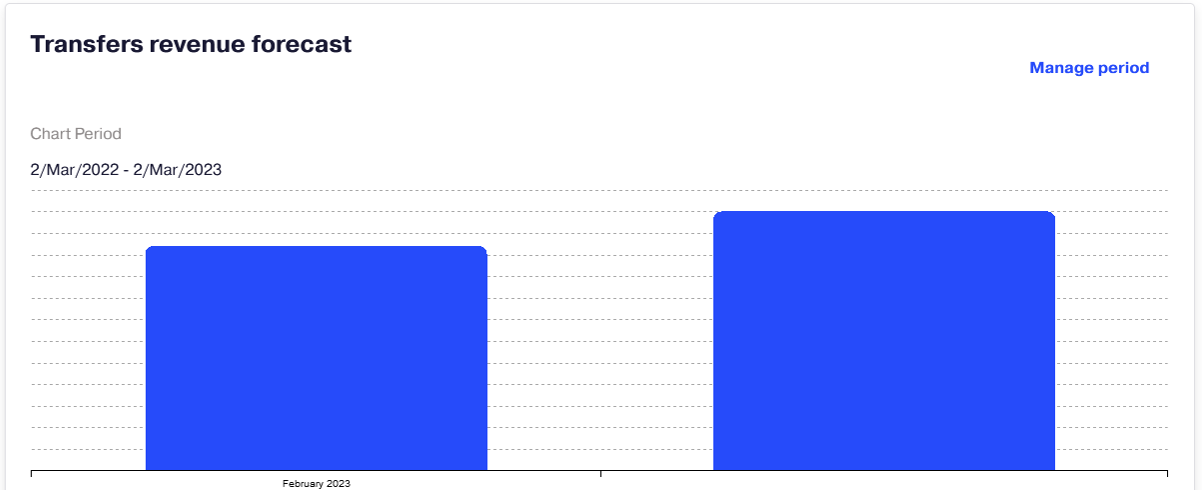
Transfers revenue forecast: It displays the revenue figure (MSRP - reseller cost) and will create a monthly sum based on when the transfer was done. When hovering the mouse over this chart, resellers will be able to see the total for the given month.
